Microbial growth (microbial_growth)
Question. How should substrate uptake vary, and when should it stop, if cumulative growth is maximized while a finite resource is exhausted?
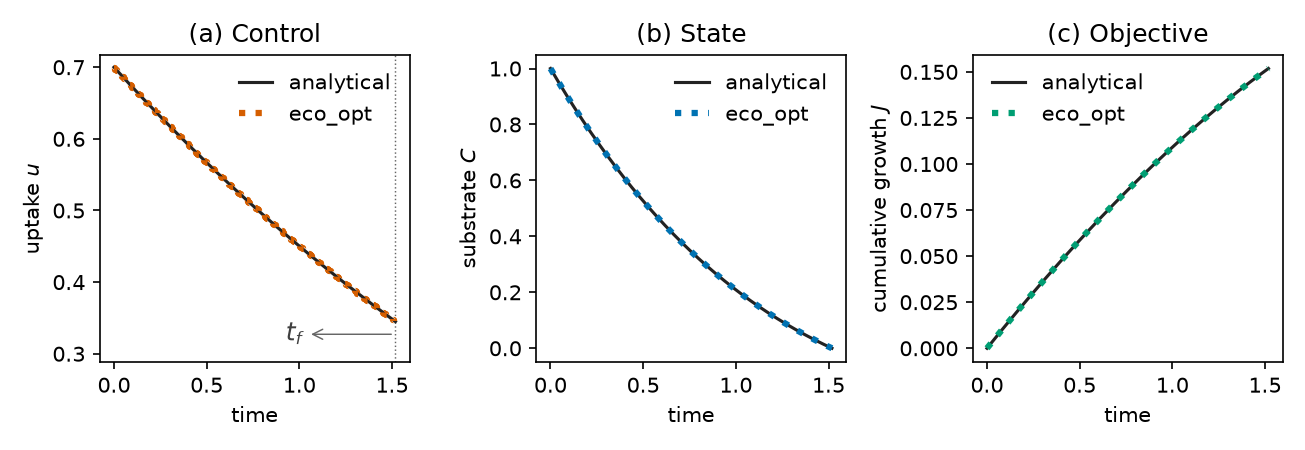
The complete first script and the eco_opt–analytical figure: First solve.
Formulation
| Symbol | Role | Meaning |
|---|---|---|
| \(C(t)\) | state | substrate |
| \(u(t)\) | control | uptake rate |
| \(G(u)\) | diagnostic | growth rate |
Dynamics.
Baseline: \(\beta=0.5\), \(\gamma=0.5\), \(r=0.1\), \(e_{\max}=0.5\), \(\mu=0.5\), \(k=0\). First-order decay \(\gamma\) is a parameter, not a control.
Objective.
Constraints.
Horizon. Free. The optimizer chooses when continued uptake is no longer worthwhile.
What was done
The right-hand side is the process model already used for forward
simulation. Uptake is declared as u(t); \(J\) is the integral of
growth; \(T\) is bounded below by zero. Direct collocation (Radau,
degree 5, 200 intervals) with IPOPT.
What we found
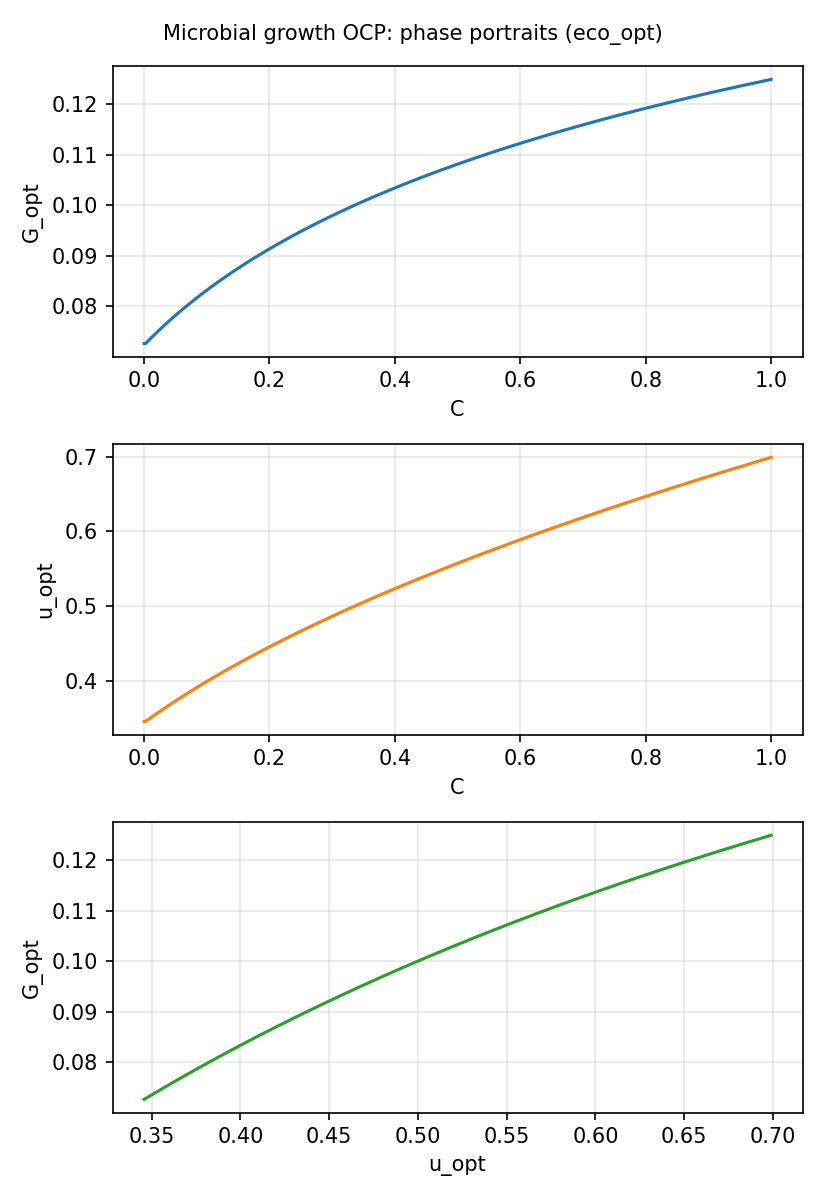
Solver succeeds; \(C(T)\to 0\) (resource exhaustion); \(C\) and \(u\) stay in their box bounds. Collocation overlays the independent analytical trajectories on First solve (\(T\approx 1.518\), \(J\approx 0.1518\)). For \(k=0\), \(r>0\), \(u^*(t)\) is a smooth interior path that declines as \(C\) is depleted.
Interpretation
A one-pool microbial model does not need a prescribed kinetic rate. An explicit growth hypothesis plus exhaustion of \(C\) already implies when uptake should fall and when activity should stop. Changing \(J\) or the bound on \(u\) would change that schedule; that is the test.
Open loop vs closed loop
An open-loop solve is a single tape \(u^*(t)\) computed from the
model you wrote, then applied from \(t=0\) to \(T\) with no further
looking at \(C\). That is what ocp.solve returns. Replaying it with
ocp.simulate(sol) integrates the same \(\dot C=f(C,u^*)\) and
must reprint \(C^*(t)\).
A closed loop (ocp.closed_loop) is different: at each sampling
instant it re-solves the remaining OCP from the measured \(C\),
applies only the first piece of the new \(u^*\), then waits. If the
world is exactly the OCP model, the closed loop reprints the open-loop
tape — there is nothing new to learn. The value appears when the
simulated process is not the forecast:
- unexpected extra substrate (a pulse of \(C\) on \([0.4,0.7]\));
- a kinetic parameter that was wrong;
- a horizon that is still running after the plan assumed exhaustion.
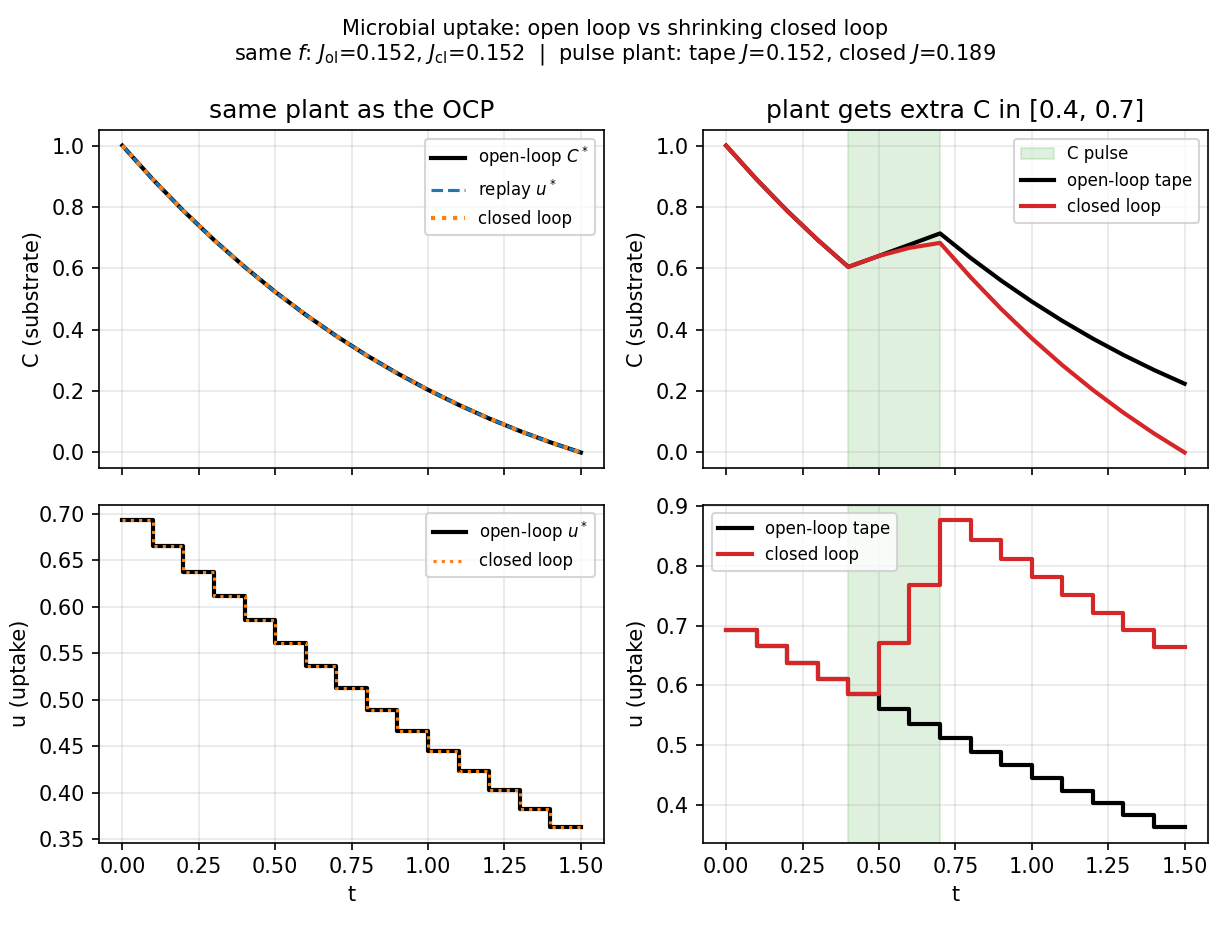
Then the tape keeps the old uptake and leaves unused \(C\). The closed loop sees the extra \(C\), raises \(u\), and captures more growth.
open_vs_closed.py pins \(T=1.5\) (the free-\(T\) optimum is about
\(1.52\)) and compares those four runs. Same process: both \(u\) series
match and \(\int G\approx 0.152\). Pulsed process: the tape still uses
the planned uptake and leaves \(C(T)\approx 0.22\) uneaten
(\(\int G\approx 0.152\)); closed loop raises \(u\) after the pulse,
exhausts \(C\), and reaches \(\int G\approx 0.190\).
That gap is the reason to close the loop in a process model: the optimality hypothesis is re-evaluated on the state you actually have, not on the state you predicted on day zero.
Public API
Same solve as examples/microbial_growth/microbial_growth.py.
import eco_opt
from eco_opt import Namespace

BETA, GAMMA, R, EMAX, MU, K = 0.5, 0.5, 0.1, 0.5, 0.5, 0.0


def growth_rate(u):
    return EMAX * BETA * (u - R) / (u + BETA) - K * u


def microbial_growth_model(t, x, u):
    Cs, uptake = x[0], u[0]
    G = growth_rate(uptake)
    dx = -uptake - GAMMA * Cs + MU * G
    y = Namespace(Cs=Cs, uptake=uptake, growth=G)
    return dx, y


sys = eco_opt.System(states=1, controls=1, model=microbial_growth_model)
ocp = eco_opt.Ocp()
ocp.max([growth_rate(sys.y.uptake)])
ocp.st(
    system=sys,
    constraints=[
        (0, "==", eco_opt.t_0(sys.t)),
        (1, "==", eco_opt.t_0(sys.y.Cs)),
        (0, "<=", eco_opt.t_f(sys.t), "<=", float("inf")),
        (0, "<=", sys.y.Cs, "<=", 1),
        (0, "<=", sys.y.uptake, "<=", 10),
    ],
)
sol = ocp.solve(
    control_intervals=200,
    polynomial_degree=5,
    collocation_points="radau",
    tf_guess=2.0,
)
print(sol.success, sol.tf, sol.objective)
Run and tests
cd examples/microbial_growth
python microbial_growth.py
python plot_microbial_growth.py
python open_vs_closed.py
python -m pytest ../../tests/test_microbial_growth.py -q
References
Manzoni, Chakrawal and Ledder (2023), doi:10.3389/fevo.2023.1094269. This is not a Yop website example.