Lindh flowering (lindh_2016_flowering)
Question. When should an annual plant switch from vegetative growth to reproduction, and how does that timing change with productivity when growth is constrained?
Here plant means that phenology model.
Formulation
| Symbol | Role | Meaning |
|---|---|---|
| \(V(t)\) | state | vegetative biomass |
| \(R(t)\) | state | reproductive biomass |
| \(u(t)\in[0,1]\) | control | fraction of production sent to \(V\) |
Dynamics.
Three \(U\): exponential \(U=V\); logistic; WBE (size-constrained).
Objective. \(\max R(T)\). Horizon. Fixed season. \(V(0)=V_0\), \(R(0)=0\).
What was done
Relaxed \(u(t)\) in \([0,1]\) on one grid. Flowering time is read off as the switch of \(u^*\). An independent 1-D line search over a single switch time is the cross-check.
What we found
The OCP is bang–bang for all three \(U\). Under exponential growth, optimal flowering time increases with productivity \(P\). Under constrained growth it can decrease — the qualitative result of the source paper.
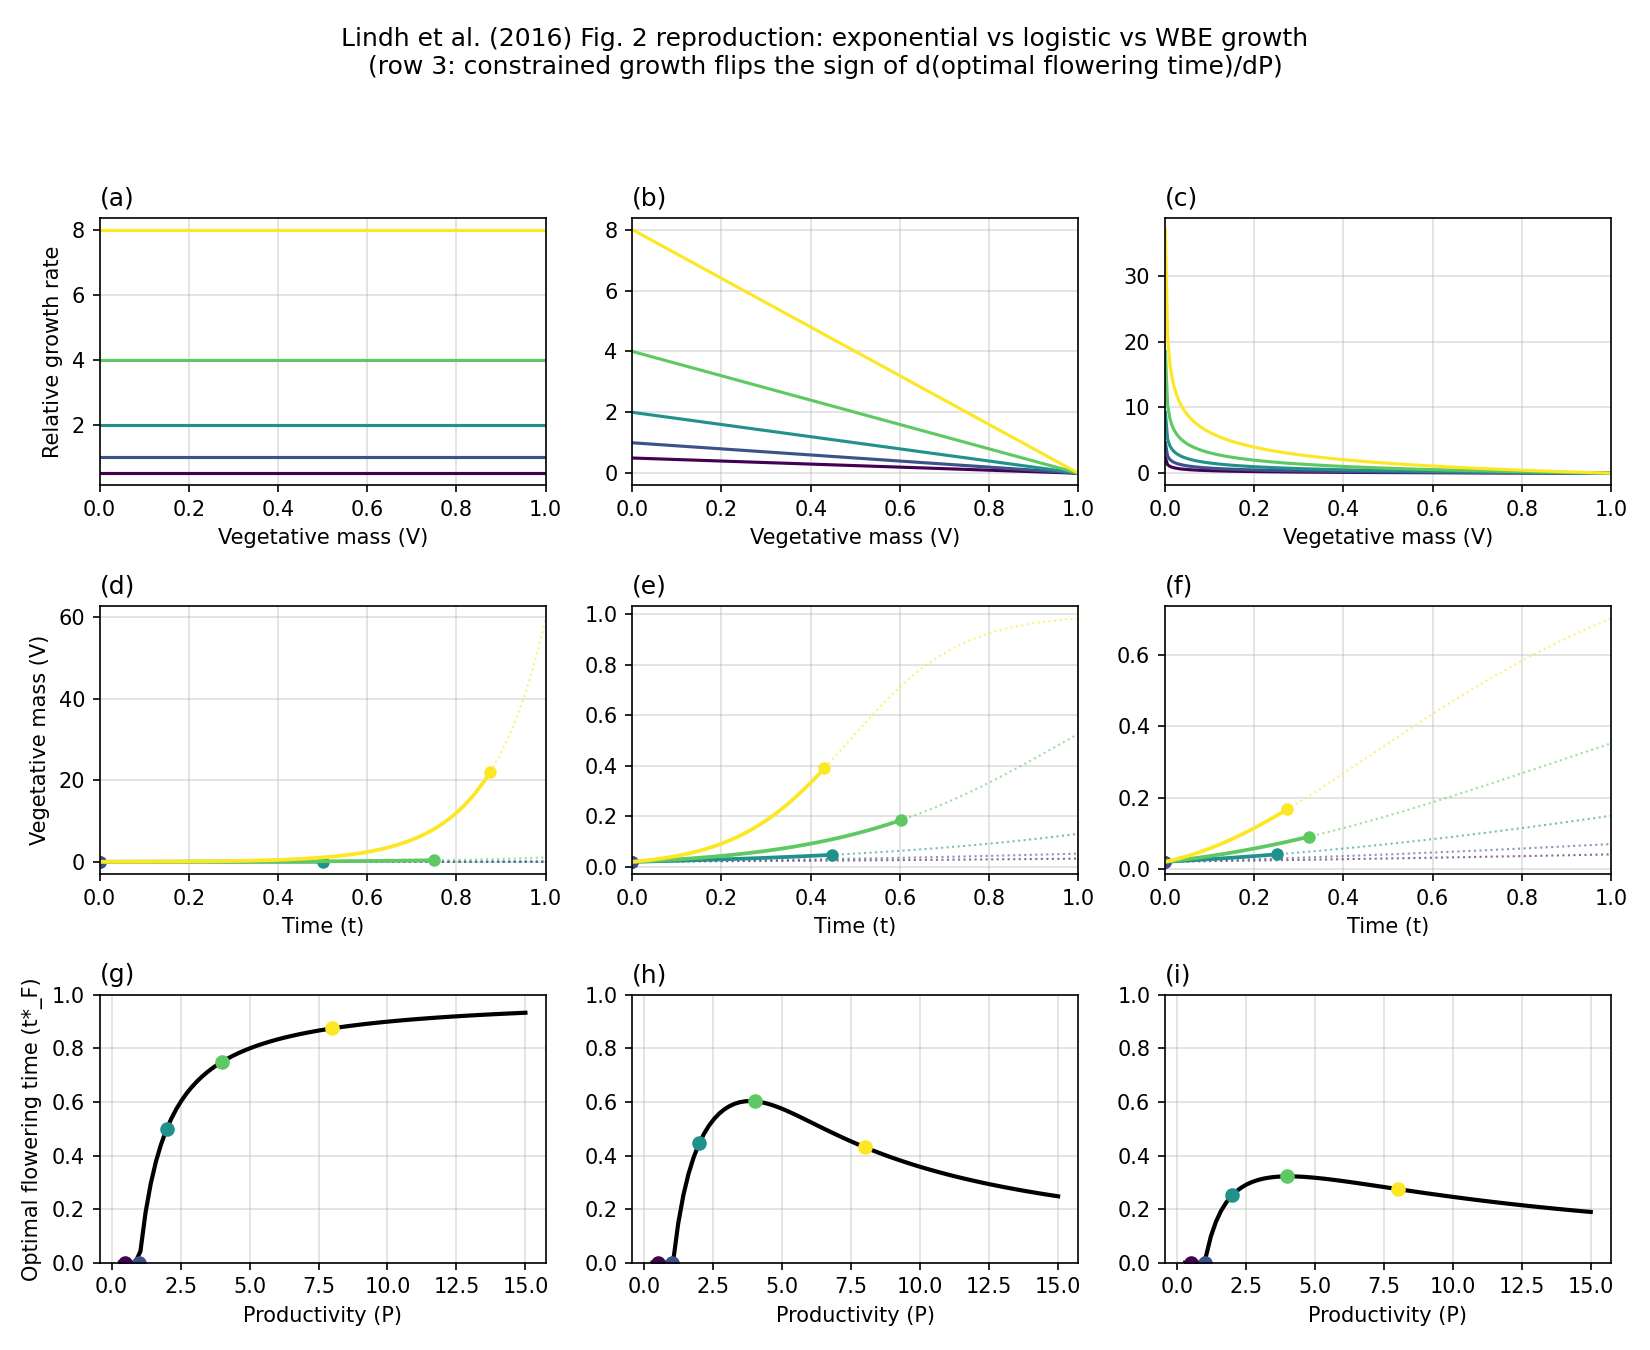
Interpretation
The same allocation ODE plus \(\max R(T)\) is not enough to fix the sign of \(\mathrm{d}t_F/\mathrm{d}P\). That sign is a property of \(U(V)\). Constrained growth is a hypothesis about production, not an extra phenology rule.
Public API
Full script: examples/lindh_2016_flowering/optimal_flowering.py.
import eco_opt
from eco_opt import Namespace


def model(t, x, u):
    V, R = x[0], x[1]
    F = P * U_fn(V)
    y = Namespace(V=V, R=R, F=F)
    return [u[0] * F, (1 - u[0]) * F], y


sys = eco_opt.System(states=2, controls=1, model=model)
ocp = eco_opt.Ocp()
ocp.max([eco_opt.t_f(sys.y.R)])
ocp.st(system=sys, constraints=[...])
Run and tests
cd examples/lindh_2016_flowering
python optimal_flowering.py
python plot_figure2.py
python -m pytest ../../tests/test_lindh_2016_flowering.py -q
References
Lindh, Johansson, Bolmgren, Lundström, Brännström and Jonzén (2016), New Phytologist 209:1591–1599, doi:10.1111/nph.13706.
Not validated against the paper’s figures
The eco_opt trajectories are not checked against the numerical
results in that paper. The example follows their formulation
(exponential / logistic / WBE production, \(\max R(T)\)). Tests
compare the OCP to an independent 1-D line search in this package,
not to Lindh et al.’s plots.